s
Contact Login Register
h M

Nash Technologies: What's Your Cost Average?

CASA Performance Results

The only NinjaTrader strategy specifically coded for ongoing cost averaging your trades.
 

* Denotes backtesting results of more than a years timeline.

*MES - 1.5 years backtesting history with 10+ profit factor

Looking for backtesting results with plenty of history?

  • 1.5 years results history
  • 10 PF
  • Maximum Quantity of 6
  • 480+ Trades, average of 1.5 trades per day
  • 3 min chart
  • Early exit stochastics with minimum of $600 profit
MES - 3min chart
MES - 1.5 years history


*MES - 1000+ trades and a maximum of 20 DCA entries

This strategy setup allows for up to 20 dollar cost average entries and has over 1.5 years of trade history results

  • 1.5 Years Backtesting
  • 1000+ Trades
  • Avg 3 Trades Per Day
  • 20 DCA Trades
  • Early Exit Stochastics
MES - 1000+ trades
MES - Avg 3 trades per day


*MES - 565 trades with over 70% profitable

Works great with many time intervals, these testing results are with a 3 min chart

  • 1.5 Years Backtesting
  • 72% profitable trades
  • Avg of 1.7 trades per day
MES - 500+ trade history 
MES - 1.5 years backtesting


*MES - Settings set to add to losers only (only add dollar cost average entries when PNL is negative)

Waits 300 bars before adding each new DCA entries

  • 1.5 Years Backtesting
  • Maximum of 5 Entries
  • Adding to losers only
  • Waiting 300 bars before new DCA Entries
MES - Adding to losers only
MES - Pause 300 bars between entries


*MES - Over 2.5 years of history and a 3.2 profit factor.

Works great with many time intervals

  • 2.5 Years Backtesting
  • 3.2 PF
  • 295 Trades
  • Avg 1 Trade Per Day
  • HighLow Entry Type
  • Maximum 20 DCA Entries
  • Three Parabolic Entry Setups
MES - 3.2 profit factor
MES - 2.5 years backtesting history


MES - 3 Min Chart

Includes two parabolic entries

  • Back testing 10-01-2022 to 04-17-2023
  • 275 Trades
  • Two Parabolic Entries
  • 15 Maximum Entries
  • 3 Minimum Chart
MES 3 Min Chart
Two Parabolic Entries


MES - Volume Spike Entry Setup

Enter only in high volume entries:

  • Back testing 10-01-2022 to 04-17-2023
  • Volume Spike Entry Setup
  • Unique Price Entries Only
  • 15 Maximum Entries
  • 22 Profit Factor
  • Minimum 50 bars between DCA entries
MES - 22 Profit Factor
MES - 6 month backtest results


MES - Stochastics Entry

Multiple alternative entry options such as moving averages or stochastics:

  • Back testing 09-01-2022 to 04-17-2023
  • 10 Profit Factor
  • 146 Trades
  • Stochastics Entry
  • Three Parabolic Entries
  • Early Exit Stochastics
  • Maximum 8 Entries
MES - Maximum of 8 entries to cap risk level
MES - Early Exit w/ Stochastics


MES - Moving Average Crossover Entry

Execute early exit when minimum profit targets have been reached:

  • Back testing 09-01-2022 to 04-17-2023
  • 15 Profit Factor
  • Moving Average Crossover Entry
  • Maximum 8 Entries
  • Three Parabolic Entries
  • Early Exit Stochastics
MES - 15 Profit Factor
MES - Take advantage of multiple parabolic entries


MYM - Hedge against the MES!

Specifically built for cost averaging without emotion:

  • Back testing 10-01-2022 to 04-17-2023
  • MES HEDGE
  • Early Exit Stochastics
  • Volume Spike Entry Setup
  • Three Parabolic Entries
MYM - Includes Hedge with MES opposite direction
MYM - Over 400+ Trades, avg of 3 trades per day. 


M2K - 18 Profit Factor w/ Two Parabolic Entries

Cost average entries to your risk level:

  • Back testing 10-01-2022 to 04-17-2023
  • 18 Profit Factor
  • Early Exit Stochastics
  • Maximum 12 Entries
  • Two Parabolic Entries
M2K - Early Exit with Stochastics
M2K - 88% Profitable with 6 Months Backtesting


M2K - 7 Min Chart w/ 45 Profit Factor

Specifically coded to support many timeframes:

  • Back testing 10-01-2022 to 02-14-2023
  • 45 Profit Factor
  • 95 Trades
  • 7 Minimum Chart
  • Three Parabolic Entries
M2K - 45 Profit Factor w/ 7 Min Chart
M2K - Utilizes all three parabolic price entries


M2K - HighLow Entry Setup, with 18 Profit Factor

Specifically coded for continuous bidding:

  • Back testing 10-01-2022 to 04-17-2023
  • 198 Trades
  • 18 Profit Factor
  • 88% Profitable
  • Maximum 12 Entries
  • High Low Entry Setup
  • Reverse Momentum Direction
  • Two Parabolic Entries
M2K - Integrated with HighLow Entry Type
M2K - 198 Trades


M2K - 67 Profit Factor w/ 128 Trades

Dollar cost averaging your trades without the emotion:

  • Back testing 10-01-2022 to 04-17-2023
  • 67 Profit Factor
  • 128 Trades
  • One Parabolic Entry
  • Stochastics Entry Setup
  • No Early Exit
M2K - Entry with Stochastics
M2K - Maximum of 10 cost average entries


M2K - 84 Profit Factor

Specifically coded for continuous bidding:

  • Back testing 10-01-2022 to 04-17-2023
  • Moving Average Crossover Entry
  • 84 Profit Factor
  • Maximum 10 Entries
  • No Hedge
  • No Parabolic Entries
M2K - No Parabolic or Hedge Entries
M2K - Utilizing Moving Average Crossover Entry


MNQ - Stochastics Entry w/ 644 Trades

Specifically coded for continuous bidding:

  • Back testing 10-01-2022 to 04-17-2023
  • Stochastics Entry
  • 2 Minimum Chart
  • 644 Trades
  • Avg 5 Trades per Day
  • Maximum 15 Entries
  • Three Parabolic Entries
  • Early Exit Stochastics
MNQ - Avg 5 Trades per Day
MNQ - 644 Trades included in backtest


MNQ - HighLow Entry Setup

Specifically coded for continuous bidding:

  • HighLow Entry Setup
  • 274 Trades
  • One Parabolic Entry
  • Early Exit Stochastics
MNQ - Integrates Parabolic Entry
MNQ - 274 Trades, avg of 2 trades per day


MNQ - Average of 4 Trades per Day

Take advantage of parabolic price movements:

  • Moving Average Crossover
  • 576 Trades
  • Three Parabolic Entries
  • Early Exit Stochastics
  • Avg of 4 Trades Per Day
MNQ - Early Exit with Stochastics
MNQ - Integrates Three Parabolic Entries


MNQ - Volume Spike Entry w/ 2 Min Chart

Exit early with minimum avg profit:

  • Back testing 10-01-2022 to 04-17-2023
  • 472 Trades
  • 2 Min Chart
  • Avg of 3.5 Trades Per Day
  • Early Exit Stochastics
  • Volume Spike Entry Type
  • Early Exit Avg Profit of 500
MNQ - 2 Min Chart
The only NinjaTrader strategy specifically coded for ongoing cost averaging your trades.


MCL

Cost average during periods of high volume:

  • 7 Min Chart
  • 137 Trades
  • 99 PF
  • Avg 1.7 Trades Per Day
MCL
MCL


* Denotes backtesting results of more than a years timeline.

MCL *

Cost average during periods of high volume:

  • 7 Min Chart
  • 3.5 Years Backtested history... from 01/01/2020 to 05/10/2023
  • Avg 2.4 Trades Per Day
  • 1098 Total Trades
MCL
MCL


MCL - Volume Spike w/ 318 Trades

Cost average during periods of high volume:

  • Back testing 09-01-2022 to 04-07-2023
  • 318 Trades
  • Volume Spike Setup
  • 15 Maximum Entries
MCL - 318 Trades!
MCL - Over 7 months Backtesting results


MCL - 81 Profit Factor w/ 15 Min Chart

Algo trade with multiple timeframes:

  • Back testing 09-01-2022 to 04-17-2023
  • 81 Profit Factor
  • 147 Trades
  • 15 Maximum Entries
  • 15 Minute Chart
MCL - 15 min timeframe
MCL - 81 Profit Factor w/ 147 trades
The only NinjaTrader strategy specifically coded for ongoing cost averaging your trades.


MGC - 3 Min Chart w/ 7.5 Profit Factor

Trade micro gold with avg of 2.5 trades per day

  • Back testing 10-01-2022 to 04-17-2023
  • 7.5 Profit Factor
  • 326 Trades
  • Early Exit Stochastics
  • 3 Min Chart
MGC - 326 Trades
MGC - Early Exit w/ Stochastics


MHG - Stochastics Entry Type

Keep emotion out of your trades:

  • Back testing 10-01-2022 to 04-17-2023
  • 7.4 Profit Factor
  • 360 Trades
  • Stochastics Entry Type
  • 15 Maximum
  • Early Exit Stochastics
MHG - Maximum of 15 entries
MHG - 360 Trades with six months backtesting results


MHG - 2 Min Chart with CandleStick Pattern Entry

Multiple entry types for initial and cost average entries:

  • Back testing 10-01-2022 to 04-17-2023
  • 2 Min Chart
  • CandleStick Patterns Entry Type
  • 25 Maximum Entries
  • Early Exit Stochastics
  • Three Parabolic Entries
MHG - Three Parabolic Entries
MHG - 2 Min Chart 


MHG - Moving Average Crossover Entry Type

Only add additional entries if PNL is negative:

  • Back testing 10-01-2022 to 04-17-2023
  • Moving Average Crossover Entry
  • Only with 400 negative PNL for more entries
  • 12 Maximum Entries
  • Early Exit Stochastics
  • Three Parabolic Entries
MHG - Early exit w/ min profit and stochastics
MHG - Moving average entry type
The only NinjaTrader strategy specifically coded for ongoing cost averaging your trades.


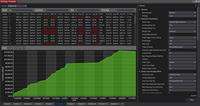
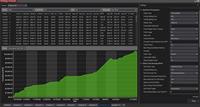
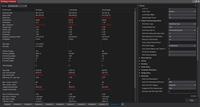
M6A - 258 Trades w/ 12.8 Profit Factor

Cost average your trades without emotion:

  • Back testing 10-01-2022 to 04-17-2023
  • 12.83 Profit Factor
  • 258 Trades
  • Only Unique Price Entries
  • Two Parabolic Entries
  • Early Exit Stochastics with $750 Min Profit
M6A - Early Exit Stochastics
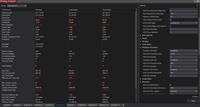
M6A - 12.8 Profit Factor


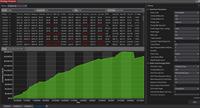
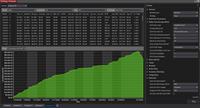
M6B - 388 Trades and Maximum of 10 entries

Over six months with proven historical results:

  • Back testing 10-01-2022 to 04-17-2023
  • 4 Profit Factor
  • 388 Trades
  • 3 Trades Per Day
  • Maximum of 10 Entries
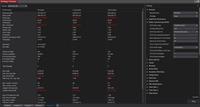
M6B - Average of 3 trades per day
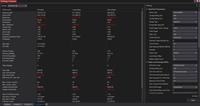
M6A - 388 Trades


M6B - Volume Spike, Only Entries Below Last Trade Price

Many options for both initial and each dollar cost average entry:

  • Back testing 10-01-2022 to 04-17-2023
  • Only Entries Below Last Trade Price
  • 142 Trades
  • Quantity 2
  • Volume Spike Setup
  • Maximum of 15 Entries
M6B - Volume Spike Entry
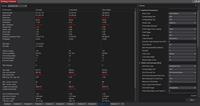
M6B - Only Entries Below Last Trade Price


M6E - Larger Quantity (5) and Maximum of 25 Entries

Specifically coded for continuous bidding:

  • Back testing 10-01-2022 to 04-17-2023
  • Volume Spike Entry Setup
  • 4 Profit Factor
  • 454 Trades
  • Early Exit Stochastics
  • Maximum 25 Entries
  • Quantity 5
M6E - 454 Trades
M6E - Early Exit Stochastics


M6E - Six Months of Backtesting

Specifically coded for cost averaging:

  • Back testing 10-01-2022 to 04-17-2023
  • Volume Spike Entry Setup
  • Early Exit Stochastics
  • Maximum 10 Entries
M6E - Early Exit Stochastics
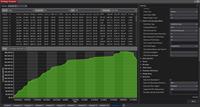
M6E - Maximum 10 Entries
The only NinjaTrader strategy specifically coded for ongoing cost averaging your trades.


VRSK -  Highlow Entry Type, 3 Min Chart

Specifically coded for cost averaging your trades:

  • Back testing 10-01-2022 to 04-17-2023
  • HighLow Entry Type
  • Early Exit Stochastics
  • 3 Min Chart
VRSK - 3 Min Chart
VRSK  - Early Exit w/ Stochastics


FISV - 295 Trades w/ avg of 2 trades per day

Trade without emotion with higher probability:

  • 295 Trades
  • Back testing 10-01-2022 to 04-17-2023
  • 78% Profitable
  • Avg of 2 trades per day
  • Early Exit Stochastics
FISV - 78% Profitable with 6 months backtesting results
FISV - Avg of two trades per day


FOXA - 10.9 Profit Factor

Utilizing standard CASA template for stocks:

  • Back testing 10-01-2022 to 04-17-2023
  • 3 Min Chart
  • HighLow Entry Type
  • Standard Stock Template
  • 10.9 Profit Factor
  • 223 Trades
FOXA - 10.9 Profit Factor
FOXA - 3 Min Chart w/ 223 Trades


AAL - 8.0 Profit Factor w/ 171 Trades

Trade with Interactive Brokers and NinjaTrader integration:

  • 8.0 Profit Factor
  • Back testing 10-01-2022 to 04-17-2023
  • 171 Trades
  • HighLow Entry Type
  • Using Default Stock Template
AAL - 171 Trades
AAL - Six Months Backtesting History


MNST - 17.4 Profit Factor w/ 273 Trades

Specifically coded for continuous cost averaging:

  • 17.4 Profit Factor
  • Back testing 10-01-2022 to 04-17-2023
  • 273 Trades
  • Only Add Near Highs
  • Early Exit Stochastics
MNST - Cost average only near high/lows
MNST - Compare results with 3, 5, and 15 min charts


EBAY - HighLow Entry Type w/ Two Parabolic Entries

Take advantage of significant parabolic price movements:

  • Back testing 10-01-2022 to 04-17-2023
  • 174 Trades
  • 4.0 Profit Factor
  • High Low Entry Type
  • Two Parabolic Entries
EBAY - Two Parabolic Entries
EBAY - 174 Trades